Stock Market · Free tools from TRUEवित्त.SPACE
Mother Tongue Claim Support
अपनी मातृभाषा में प्रक्रिया और मार्गदर्शन पढ़ें
The New AI Bubble: What the 2000 Dot-Com Crash Teaches Us About 2026
News Context
Alphabet fell 12.6% on 29 October 2026, its worst day on record, as AI spending outran cash flow.
Source: Company results, October 2026 · 29 Oct 2026
Is the AI bubble bursting? In China, it already has. In the US, what we are seeing in October 2026 is a correction, not a crash — yet. China's STAR50 index of AI and chip stocks has fallen about 40% from its July peak. US AI stocks have had a sharp but much smaller fall. The technology is real, and AI revenue is growing fast. The worry is that spending, borrowing and stock prices are running ahead of that revenue.
That story has a famous precedent: the dot-com bubble of 2000. The internet was real too. It still took investors years to get their money back. This article walks through what is happening now, why, what happened in 2000, how long the recovery took, who quietly benefited from the crash, and what needs to happen next.
What is happening now
In the last week of October 2026, US AI stocks had their worst days in months. Investors did not punish weak demand. They punished the cost of building AI.
- Alphabet (Google) fell 12.6% on 29 October, its worst day on record, even though Google Cloud revenue grew 103%. It spent $51.4 billion on capex in one quarter, and its free cash flow turned negative at −$9.1 billion.
- Meta reported its first negative free cash flow in more than ten years and launched a share sale of up to $95 billion to fund AI.
- Amazon's free cash flow over the last twelve months fell to −$42.4 billion, even as AWS grew 39%.
- Microsoft, the one giant still funding AI from its own cash, was largely spared.
- The Nasdaq fell 2.9% on 30 October. The S&P 500 fell 1.8%.
China: where the bubble already burst
China gives a preview of what a burst looks like. The STAR50, its index of AI and chip companies, fell about 40% from its July peak, wiping out roughly $480 billion. Several leaders halved, including GPU makers Moore Threads and MetaX and robot-maker Unitree.
The cause was not that Chinese AI failed. Revenue was growing. But in July the index traded at about 250 times earnings, against about 30 for America's Nasdaq-100. Retail speculation ran wild: AI stocks made up about 57% of all trading, and Unitree's IPO was oversubscribed roughly 8,000 times. A chip price war, threatened US equipment bans and tax-driven selling pulled the trigger. Even after the crash, the index still trades near 100 times earnings.
The lesson from China: a bubble can burst while the technology works and revenue grows, if the price paid runs too far ahead.
Why it is happening
The short answer: spending is running years ahead of revenue, and borrowed money is filling the gap.
- Record spending. The five biggest cloud companies (Amazon, Microsoft, Alphabet, Meta, Oracle) are on track to spend about $800 billion on data centres, chips and power in 2026. Goldman Sachs expects $1.2 trillion in 2027 and $1.4 trillion in 2028. It estimates about $300 billion a year of AI revenue is needed just to justify that spend.
- Cash is running out, so debt is coming in. In 2024, borrowing covered about 9% of this spending. By mid-2026 it covered about 32%. Meta is selling shares, Oracle is borrowing heavily, and S&P has cut Oracle's credit rating to BBB−, one notch above junk.
- Lenders are getting nervous. The cost of insuring against a CoreWeave default rose above 1,000 basis points in October, a level normally reserved for distressed companies. Oracle's hit a record.
- Money going in circles. The IMF studied 14 AI deals since 2023 and found about $1.4 trillion of future revenue commitments that flow back to the investors themselves. A chipmaker invests in an AI lab, and the lab uses that money to buy the chipmaker's chips. It works only while money keeps flowing. The real deals are mapped below.
- Higher interest rates. The US 10-year bond yield touched 5.31% in early October, and two Federal Reserve officials voted for a rate hike. Higher rates make future AI profits worth less today, and make debt costlier to carry.
China shows where point 4 and stretched prices can lead. The US is not there yet, but the direction of travel is what worries markets.
How the money loop works: the real deals
Nvidia's money goes into its customers, and comes back to Nvidia as chip sales. Follow one dollar around the loop:
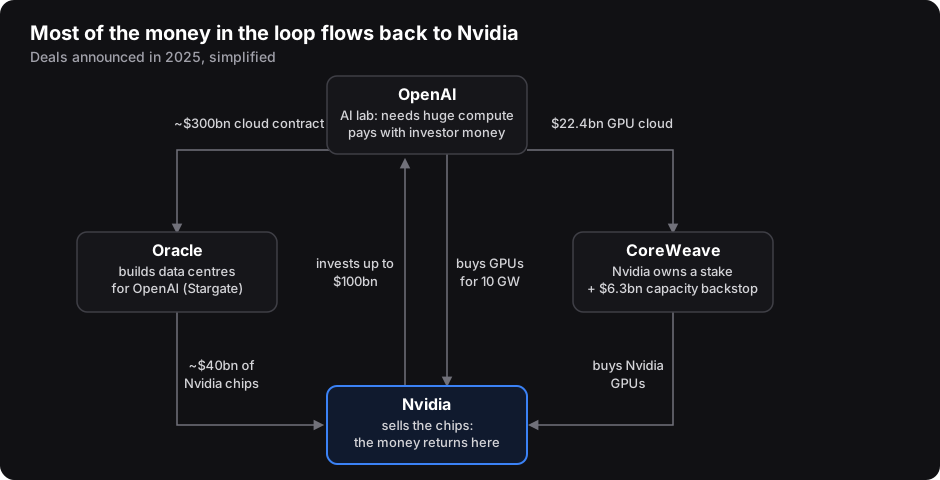
- Nvidia → OpenAI. In September 2025, Nvidia agreed to invest up to $100 billion in OpenAI. OpenAI plans to build at least 10 gigawatts of data centres filled with Nvidia systems. Much of Nvidia's investment comes back to Nvidia as GPU orders.
- OpenAI → Oracle → Nvidia. OpenAI agreed to buy about $300 billion of cloud computing from Oracle over five years. To build that capacity, Oracle plans to spend about $40 billion on roughly 400,000 Nvidia chips for one Texas site alone.
- OpenAI → CoreWeave → Nvidia. OpenAI's contracts with CoreWeave total $22.4 billion. CoreWeave buys Nvidia GPUs to deliver them. Nvidia also owns a stake in CoreWeave and agreed to buy up to $6.3 billion of any capacity CoreWeave cannot sell, through 2032. That guarantee makes it safer for CoreWeave to order even more Nvidia chips.
- AMD's version. OpenAI agreed to deploy 6 gigawatts of AMD chips. In return, AMD gave OpenAI the right to buy up to 160 million AMD shares, roughly 10% of the company, at a nominal price as the chips are deployed. The supplier is effectively paying its customer in its own shares.
The pattern continued into 2026. Nvidia is reported to be financing up to $105 billion for an OpenAI data centre in Ohio, and chipmakers including Nvidia showed interest in buying up to $5 billion of Meta's new shares.
Why this matters: each company reports real, growing revenue, but part of it is the same money passing through several hands. The whole loop rests on one thing: end customers paying OpenAI and others enough to cover the bills. If that revenue grows slower than expected, every link weakens at the same time. That is why the IMF counts about $1.4 trillion of these circular commitments as a risk to financial stability.
What happened in the 2000 dot-com bubble
In the late 1990s, investors were sure the internet would change everything. They were right. They just paid far too much, far too early.
- The boom. Any company with ".com" in its name could raise money. On 10 March 2000 the Nasdaq peaked at 5,048, trading at about 190 times earnings.
- The bust. By October 2002 the Nasdaq had fallen to 1,114, a drop of about 78%. Companies with no profits, such as Pets.com and Webvan, shut down.
- The infrastructure crash. Telecom companies had borrowed hundreds of billions of dollars to lay fibre-optic cable for traffic that had not arrived yet. More than 60 telecom firms failed between 2001 and 2003, including Global Crossing; WorldCom collapsed in an accounting fraud. By 2002, roughly 97.5% of long-haul fibre was lying dark, unused.
- Even the winners crashed. Amazon's share price fell nearly 95% between late 1999 and September 2001, even though its sales kept growing. It survived because it had raised $672 million in early 2000, before the money dried up.
- India felt it too. The Sensex crossed 6,000 in February 2000, then slid to the 2,600 range, a fall of about 55%. The Ketan Parekh scam, built on inflated tech stocks, came apart in 2001.
The key point: the internet did not fail. The price of the internet did.
The business kept growing while the price collapsed. A rough comparison of the same years:
| Measure | Before | After | Change |
|---|---|---|---|
| Internet users worldwide (the business) | 381 million (2000) | 795 million (2004) | More than doubled |
| Amazon revenue (the business) | $1.63 billion (1999) | $3.93 billion (2002) | +141% |
| Amazon share price (the price) | Dec 1999 peak | Sep 2001 low | About −95% |
| Nasdaq index (the price) | 5,048 (Mar 2000) | 1,114 (Oct 2002) | −78% |
In plain terms: twice as many people were online and Amazon was selling more than twice as much, yet its shares were worth a twentieth of their peak. Investors had paid in 1999 for growth that would take a decade to arrive. Sources: ITU, CompaniesMarketCap.
The same split is visible in October 2026: Google Cloud revenue grew 103% in a quarter, and Alphabet's share price still fell 12.6% in a day.
Parallels and differences: 2000 vs 2026
The stories rhyme in their infrastructure and their excitement. They differ sharply in the profits of the leaders.
| Factor | Dot-com, 2000 | AI, 2026 |
|---|---|---|
| The technology | Real (the internet) | Real (AI) |
| Infrastructure race | Telecoms borrow to lay fibre ahead of demand | Big Tech borrows to build data centres ahead of revenue |
| Who funds it | Debt-laden telecoms, IPO money | Big Tech cash, plus fast-growing bonds and share sales |
| Market-wide valuation | Shiller CAPE 44.2 (Dec 1999) | Shiller CAPE 41.6 (Oct 2026) |
| Valuation of leaders | Nasdaq at ~190× earnings | S&P 500 at ~19× next year's earnings, below its 5-year average |
| Leaders' profits | Many leaders had none | Leaders are among the most profitable companies ever |
| Demand today | Traffic far below capacity (97.5% fibre dark) | Demand for AI computing still exceeds supply |
| Speculative froth | Any ".com" IPO | China's STAR50 at ~250× earnings; debt-funded US players like CoreWeave |
Where it rhymes: borrowing to build capacity before customers fully arrive, and prices that assume everything goes right. Where it differs: today's US leaders earn huge profits and demand currently exceeds supply. That is why the US looks like a correction while China looked like a bubble.
How long the recovery took
Buying at the top of a bubble can cost you a decade or more. The Nasdaq took 15 years to get back to its 2000 high.
| Index or stock | 2000-era peak | Regained it | Time taken |
|---|---|---|---|
| Nasdaq Composite | 5,048 (Mar 2000) | Apr 2015 | ~15 years |
| Amazon | $106.68 (Dec 1999) | Oct 2009 | ~10 years |
| S&P 500 | 1,527 (Mar 2000) | Mid-2007, then lost again in 2008 | ~7 years (13 years for good) |
| BSE Sensex | ~6,000 (Feb 2000) | Jan 2004 | ~4 years |
Three lessons stand out:
- The index and the survivors told different stories. The Nasdaq index needed 15 years. Amazon, which kept growing through the crash, recovered in 10 and then went on to become one of the most valuable companies in the world.
- India recovered fastest. The Sensex had far less exposure to dot-com stocks and was driven by the wider economy, so it got back in about four years.
- Time in the market helped, timing the top hurt. An investor who kept adding money through 2001–2003 bought at deep discounts. One who invested a lump sum at the March 2000 peak waited 15 years to break even.
Who benefited after the crash
Investors lost money in 2000, but customers and new founders inherited a cheap, ready-made internet. The crash moved the cost of the boom onto the people who financed it, and handed the benefits to everyone who came after.
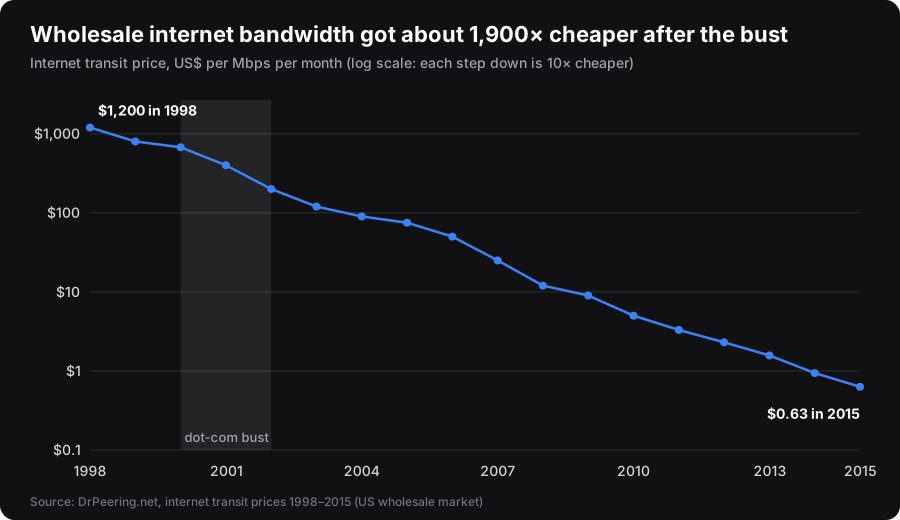
- Cheap bandwidth. All that unused fibre was sold off at a fraction of its cost. Level 3 bought up assets from failed rivals and at its peak carried about 70% of global internet traffic. Bandwidth prices kept falling for two decades, which made video streaming and later Netflix possible.
- Cheap servers and talent. Failed dot-coms dumped equipment, office space and skilled engineers onto the market. Starting an online business became far cheaper in 2003 than it had been in 1999.
- A new generation of companies. Google listed in 2004. Facebook started in 2004 and YouTube in 2005. Amazon, with the bust behind it, launched Prime in 2005 and AWS (its cloud business) in 2006. None of these needed to build their own fibre; the bubble had already paid for it.
- Customers got better, cheaper service. Faster internet at lower prices, free email and search, and online shopping that worked.
How much cheaper the internet became
Globally, the bandwidth the bubble built became almost free. The price internet providers paid each other for capacity fell from $1,200 per Mbps in 1998 to $0.63 by 2015.
In India, the fall for ordinary users was even bigger.
| When | What you paid | Rough price per GB |
|---|---|---|
| Aug 1995 (VSNL launch) | ₹25,000 for 250 hours of dial-up at 9.6 kbps | ~₹23,000 (at full speed, best case) |
| Mar 2014 | Mobile data | ₹269 |
| Jun 2024 | Mobile data | ₹8.31 |
That is roughly 2,800 times cheaper in thirty years, before even adjusting for inflation. The 1995 figure is our own estimate: 250 hours at 9.6 kbps can carry at most about 1 GB. Sources: NewsMobile on VSNL's 1995 plan, Government of India via News On AIR.
The AI parallel for India
If the AI build-out over-shoots, the same pattern could repeat. Spare data-centre capacity and price competition would make AI computing and AI tools cheaper. That is good news for anyone who uses AI rather than builds it:
- A small business in Mangaluru or Bengaluru could automate customer support, accounts and marketing at a fraction of today's cost.
- Indian startups could build AI products without paying peak prices for computing.
- Freelancers and professionals could get more capable tools for less.
How much cheaper AI has already become
AI is getting cheaper even faster than the internet did. The cost of the same AI ability has fallen about 10 times every year, against roughly 36% a year for internet bandwidth after 2000. Prices are per million tokens (a token is roughly three-quarters of a word).
| Market | Then | Now | What drove it |
|---|---|---|---|
| US | GPT-3 (Nov 2021): ~$60 per million tokens | GPT-3-level ability (Nov 2024): $0.06, about 1,000× cheaper. Top model GPT-5.5 (2026): $5 input / $30 output | Competition, better chips, smaller efficient models |
| China | ByteDance's Doubao (May 2024): ¥0.8 (~$0.11), about 98% below GPT-4o's $5 | DeepSeek V4 Pro (May 2026): $0.435 input / $0.87 output, output about 34× cheaper than GPT-5.5 | A price war among Chinese tech giants and start-ups |
| India | Mostly a buyer of US and Chinese models | Government's IndiaAI portal rents GPUs at ₹67 an hour (Mar 2025), over 14,000 GPUs | Public subsidy for compute, aimed at start-ups and researchers |
The comparisons are rough: cheap models are not as capable as the newest ones, and prices shift every few months. The direction is not in doubt. As with bandwidth after 2000, the people building AI are fighting on price, and the people using it are the ones collecting the savings.
The 2000 lesson is clear: the builders of the infrastructure often lose; the users of it often win.
What brought the comeback, and what must happen now
The internet came back when profits caught up with the hype. By 2015 the Nasdaq traded at about 25 times earnings, against about 190 at the 2000 peak. The same leaders were back, but this time the price matched the business.
| Comeback driver | What changed after 2000 | What must happen now for AI |
|---|---|---|
| Real revenue | Broadband reached homes; ads and e-commerce became profitable businesses | AI revenue must catch up with spending (Goldman's rough bar: ~$300bn a year) |
| Cash, not hope | Survivors like Amazon turned profitable | Big Tech's free cash flow must turn positive again; S&P Global does not expect that before 2028–29 |
| Cheaper money | Interest rates were cut and stayed low for years | Rates and the US 10-year yield (near 5%) need to ease |
| Prices reset | Valuations fell to match earnings | China's STAR50, still ~100× earnings, may need to fall further; US froth must cool without panic |
| Debt holds | Over-indebted telecoms went bust and were absorbed | Indebted players like CoreWeave and Oracle must refinance without a default |
| Proof of value | Businesses and consumers saw clear benefits online | Companies must show measurable productivity gains from AI, not just pilots |
If most of these boxes get ticked over the next two to three years, today's correction will look like a pause in a long boom. If spending keeps outrunning revenue while debt piles up, the 2000 script becomes more likely.
The verdict: China burst, the US is correcting
China shows what a burst AI bubble looks like. The US is not there. Today it is a correction. The technology is real, the leaders are profitable, and US valuations are nowhere near China's. But the dot-com lesson is that a real technology can still crash if prices run too far ahead. The risk is not AI failing; it is debt and prices getting ahead of revenue.
Signals to watch
Two signals would turn this correction into something bigger:
- A tech giant cuts its capex plan. That would mean the people closest to the numbers no longer believe the returns.
- An indebted AI player fails to refinance its debt. That is how 2000's telecom crash spread.
Near-term dates: Nvidia's results on 17 November 2026, a large AI IPO expected in mid-November, and the US Federal Reserve's decision on 9 December 2026.
What this means for an Indian investor
- Know your exposure. International and Nasdaq-100 funds hold the US AI giants directly. Holding two such funds can mean double exposure to the same few stocks.
- Watch Nifty IT's see-saw. Through 2026, Indian IT stocks have often risen when global AI stocks fell, and fallen when they rallied, as money rotated between them.
- Avoid leverage on AI themes. Futures, options and margin trades can wipe out capital in a sharp fall.
- Keep SIPs running and rebalance. 2000–2003 rewarded those who kept investing steadily and punished lump sums put in at the top.
Quick answers
Has the AI bubble burst in 2026?
In China, yes: the STAR50 fell about 40% from July. In the US, no: it is a correction so far, with sharp falls in companies spending heavily on AI.
Is this like the dot-com bubble?
Partly. Both involve a real technology and heavy infrastructure spending ahead of demand. The difference is that today's US leaders are highly profitable, while many dot-com leaders had no profits.
How long did markets take to recover after 2000?
The Nasdaq took about 15 years, the S&P 500 about 7, and India's Sensex about 4.
Who benefits if AI corrects?
Users of AI. As in 2000, spare capacity and price competition would make AI tools and computing cheaper for businesses and individuals.
Related reading: India PMI and growth, Sensex rebound.
Sources
Show all 22 sources
-
Admirals — AI Bubble: What Alphabet's Results Mean Before Nvidia Reports (US results, capex, IMF, valuations)
-
Angelo Lima — The AI Bubble: Before the Storm (October sell-off, credit signals)
-
Yahoo Finance — AI Bubble Bursts in China, Wiping $480 Billion
-
Phys.org — After 15 years, Nasdaq recoups losses of dot-com crash
-
The Register — AI's trillion dollar deal wheel bubbling around Nvidia, OpenAI (circular deals)
-
DrPeering — Internet Transit Pricing: Historical and Projected
📊 Crunch Your Numbers
Don't let market noise distract you from your financial goals. Use our free tools to stay on track.
Keep Reading
Sensex Snaps Losing Streak to Cross 77,300: Is the Market Rebound Here to Stay?
27 Apr 2026 · 3 min read
India's Real Estate Hit Record Highs in 2024. Is Buying a House Still Worth It?
29 Apr 2026 · 5 min read
Nifty Crosses 24,000 as Sun Pharma Surges 7% on $11.75B Mega-Deal
28 Apr 2026 · 4 min read
Disclaimer
This article is for educational and informational purposes only. It does not constitute financial advice. Please consult a SEBI-registered investment advisor before making investment decisions. TRUEवित्त.SPACE is not SEBI/IRDAI/AMFI registered.